Richard PinThe Quantastic JournalClimate Change For Cities: Mitigation And AdaptationHow does climate policy get enacted on the local level? Problems, Policy, and Politics…5d ago5d ago
Richard PPowerShell: Create an HTML report from SQLHumans need easy-to-read reports. Create an HTML file with tables for fast consumption.Jun 12Jun 12
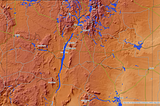
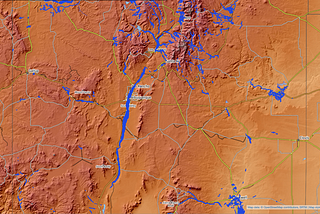
Richard PNew Mexico Acequias: QGIS Cloud Web MapView a map of New Mexico acequias in your browser with data from New Mexico RGIS.Jun 9Jun 9
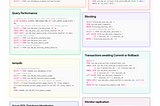
Richard PMS SQL Server Performance ChecklistGet the most out of your SQL Server on-prem instance with this checklist of configuration settings.May 26May 26
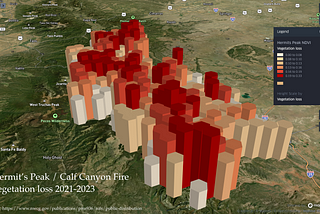
Richard PinPython in Plain EnglishCreate an Extruded Polygon Map with Kepler.gl and Google Earth Engine Satellite dataimage created by authorDec 2, 2023Dec 2, 2023
Richard PinPython in Plain EnglishTesselate a GeoDataFrame into Hexagons Using PythonTesselation is a method of breaking up a geometry from a single polygon (or multipolygon) into a collection of polygons that are continuous…Nov 21, 2023Nov 21, 2023
Richard PDeploy a SQL Server 2022 container in less than 10 minutesSet up a Linux SQL Server database in less than 10 minutes using Docker. With a containerized version of SQL Server, you can run the…Sep 14, 20231Sep 14, 20231
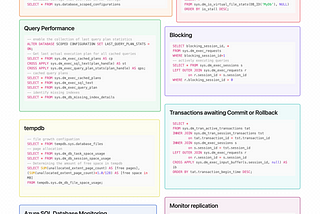
Richard PSQL Server Dynamic Management Views (DMVs) cheatsheetThese DMVs and catalog views can help you to monitor database performance and troubleshoot slow queries. This is a cheatsheet focused on…Aug 26, 2023Aug 26, 2023
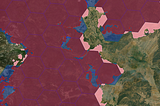
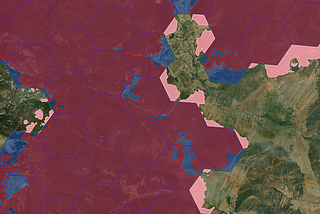
Richard PinPython in Plain EnglishScrape satellite data for every US wildfire in 2022 using Python and Google Earth EngineWhat is NDVI?Aug 15, 2023Aug 15, 2023
Richard PMapping Fracking Wells in Colorado with PostgreSQLUse SQL to Analyze Data and Draw MapsApr 17, 20222Apr 17, 20222